OllyDbg 2.01

September 27, 2013 - version 2.01. OllyDbg, empty language file, chicken language fileDisassembler 2.01 (GPL v3, preliminary version without documentation)

New version with many new features, among them:
Yes, you understand it correctly. OllyDbg graphic interface supports multiple languages. All you need is the corresponding language file. Currently there are none, but I expect that the volunteers will be able to make more or less complete translations.

Plugins compiled for OllyDbg 2.01 beta are 100% compatible with v2.01. PDK will be updated... soon...

Preliminary version of Disassembler 2.01 is almost ready. That is, the sources are more or less final but documentation and ready-to-use DLLs are still missing. I release Disasm 2.01 under GPL v3. Commercial licenses are also possible.


November 19, 2012 - update. OllyDbg, sample plugins, preliminary plugin API, test application

This is a major update of the plugin interface. Now plugins can actively influence the debugging process. They may set temporary breakpoints (Plugintempbreakpoint()) and receive notifications if breakpoint is hit (ODBG2_Plugintempbreakpoint()). If they receive exception notification, ODBG2_Pluginexception() may request to pause application or step over this exception. ODBG2_Pluginnotify() is extended and can force different mode of execution than requested by user.

If necessary, plugin may create one or several options pages in a new Plugins options dialog, which is very similar to the Options. Pluginshowoptions() directly opens plugin-related options page.

There is a new sample plugin, traceapi.dll, that demonstrates new features. It uses one-time memory breakpoints to detect all calls from the user code to the Windows API and protocols the arguments and values returned by APIs. Sample code does not include the Visual Studio project for traceapi. This is despairing - to compile a plugin, I must change several options, like unsigned characters, byte alignment, DLL, UNICODE, import libraries (btw it looks like my VS accepts only absolute paths for implibs!) etc. - TWICE! - once for debug and second time for release configuration. As .vcproj includes GUIDs, I can't simply rename it. Instead, I must recreate new project FROM THE SCRATCH! (yes, all capitals text is a net equivalent of shouting). There is something called "property sheets", but I have found no possibility to save existing options to the property sheet. So if you have a solution to this problem MS feature, please let me know.

Plugin documentation is still far away from finished but is strongly updated.

OllyDbg itself got several bugfixes and minor improvements.

As always, your comments and questions are welcome.


October 04, 2012 - update. OllyDbg, Bookmark plugin

Many bugfixes and several improvements. Plugin interface is still under development.

I've got rid of a very nasty crash. Maybe half of such crashes happened within the GlobalAlloc(), the remaining were almost unpredictable. Of course, it was buffer overflow, what else?

Debugging engine is now more stable, especilally if one steps into the exception handlers. There is a new debugging option, "Set permanent breakpoints on system calls". When active, it requests OllyDbg to set breakpoints on KERNEL32.UnhandledExceptionFilter(), NTDLL.KiUserExceptionDispatcher(), NTDLL.ZwContinue() and  NTDLL.NtQueryInformationProcess(). For example, if CPU is in the exception handler and you set hardware breakpoint, it won't hit! NTDLL.ZwContinue() restores original contents of registers and modifications get lost. Therefore OllyDbg sets temporary INT3 break on ZwContinue() and applies changes to the copy of the context in memory. But sometimes it simply doesn't know that temporary breakpoint is necessary. If process is being debugged, Windows don't call the unhandled exception filter. Instead, it notifies debugger. To pass exception to the filter, OllyDbg intercepts NtQueryInformationProcess(). If handler asks OS whether process is debugged, OllyDbg reports "no". And so on. Well, if this new option is so advantageous, why not to make it default? Because some viruses check for INT3 breakpoints on these APIs.

Sometimes it's necessary to rename the OllyDbg, for example if you investigate a brainless virus that scans process names and hopes to avoid debugger. You rename OllyDbg to, say, notadebugger.exe and... and... and all plugins are missing?! They are statically linked to the DLL named ollydbg.exe. Of course, GetProcAddress() would help, but this makes programming to the nightmare. Therefore when OllyDbg loads plugins, it applies a dirty trick which lets Windows think that the main module is named ollydbg.exe and not notadebugger.exe. This trick works under Windows XP, but I am not sure whether Vista/Win7 use the same internal data structures. Please check.

Hit trace can be saved between the sessions. If code is self-modifiable, use this option with care. When OllyDbg restores hit trace, it sets INT3 breakpoint on every marked command. This may lead to crash of the debugged application.

Due to the invalid handling of prefixes 66, F2 and F3, command search was unable to find SSE commands. This bug is corrected.

Currently I am working on the plugin interface. Plugins will be allowed to set temporary breakpoints and process exceptions. This requires significant changes in the debugging engine and may take another couple of weeks.


August 30, 2012 - major update for plugin authors. OllyDbg, Bookmark plugin,
preliminary plugin API, test application

I have signifiicantly changed the way OllyDbg and plugins interact with each other. For example, all functions with fixed number of arguments are declared as __cdecl instead of __stdcall. This removes problem with Visual C that always wants to emit something like _Disasm@32 instead of plain _Disasm or Disasm. Otherwise there are only minor changes. Among them, several of OllyBugs are no longer.

Bookmark plugin now works with 4 different compilers: Borland C++ Builder 5.0 (ancient but still my favorite), command-line Borland C++ 5.5 (produces exactly the same DLL), Visual C++ 2005 (Express Edition) and Code::Blocks (in fact, MinGW which is GNU for Windows). There are separate import libraries for each. Plugin source is identical in all cases. I hope that VC library will also work with all otrher Visual versions. Detailed description will be available later - as always...

Help on API is extended but not as far as I expected. Again: If you need some API function or family that is not yet documented, drop me a mail and I'll try to describe it ASAP.

That's all, enjoy!


August 18, 2012 - OllyDbg 2.01 beta 2. OllyDbg (already updated), Bookmarks plugin, preliminary plugin API, test application

I vas very busy the whole year, so my work was veeery slow. I am very sorry for this. Anyway, now I hav a bit more free time and will continue the development (and documentation, don't forget the documentation!)

OK, so what's new here? OllyDbg itself is hardly changed, only minor improvements (like correct reaction on MOV SS,anything; PUSHF or disassembling of JE vs. JZ  etc. depending on the preceding comparison). More important, I have (hopefully) removed the nasty crashes that happened on some computers while invoking menu, or pressing ALT, or on similar harmless actions.

Update: No, I haven't removed all bugs at the first try. I have kept some information about menu items directly in the menu, using dwItemData in MENUITEMINFO. It seems that Windows also uses this item! Now I have moved pointers to data to another location.

Plugin interface is slightly extended. Plugin API includes more than 500 functions, structures and variables. Of these, I have described less than 100, so you will frequently encounter 404 while browsing the help data. But all APIs used by Bookmarks plugin are fully documented. I plan that I'll describe another hundred within the next two weeks.

You may already start writing your plugins. If you need some API function or family that is not yet documented, drop me a mail and I'll try to describe it ASAP.

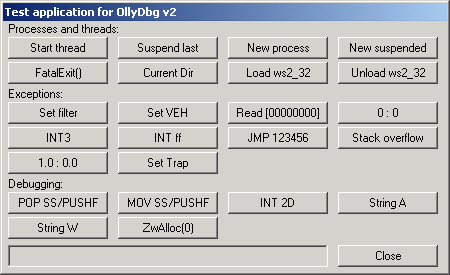
There is a small test application, Test.exe, that I've written to simulate errors. I think that it may be helpful to learn OllyDbg. Feel free to use it as you want. The source code is enclosed:

Test.exe

The buttons do the following:


August 03, 2011 - OllyDbg 2.01 alpha 4. Here is Alpha 4, here is Bookmarks plugin

As you see, this version already supports plugins. New plugin interface is similar to the old (v1.10) but is not backwards compatible. It includes more than 350 API functions, 60 or so variables and many enumerations and structures that all need to be documented. This will take a while, therefore I decided to make a preliminary release. It includes plugin header file (plugin.h) and commented bookmarks source code (bookmark.c). Writing your own plugins without the documentation is a pure masochism, but at least you will be able to analyse the structure of the interface and  send me your comments, wishes and suggestions.

This is the last alpha release. After plugin documentation is ready, I will call it 2.01 beta 1. Then I will start to write OllyDbg help and finally make the full 2.01 release. Till then, I plan no major changes.

Other new features in this version:

- Patch manager, similar to 1.10
- Shortcut editor, supports weird things like Ctrl+Win+$ etc. Now you can customize and share your shortcuts. I haven't tested it on Win7, please report any found bugs and incompatibilities!
- Instant .udd file loading. In the previous versions I've postponed analysis, respectivcely reading of the .udd file till the moment when all external links are resolved. But sometimes it took plenty of time, module started execution and was unable to break on the breakpoints placed in the DLL initialization routine
- Automatic search for the SFX entry point, very raw and works only with several packers. Should be significantly more reliable than 1.10. If you tried it on some SFX and OllyDbg was unable to find real entry, please send me, if possible, the link or executable for analysis!
- "Go to" dialog lists of matching names in all modules
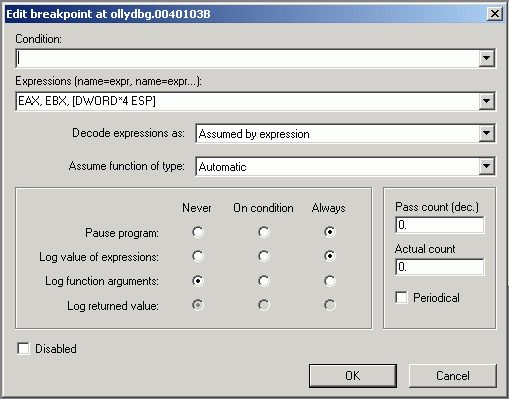
- Logging breakpoints can protocol multiple expressions. Here is an example: I ask OllyDbg to protocol the contents of EAX, EBX and 4 memory doublewords starting at address ESP. Expressions must be separated by commas, repeat count has form SIZE*N, N=1..32:

Breakpoint with multiple expressions to protocol

This is what you will see in the log when breakpoint is hit:

Multiple expressions protocolled

Many not-so-important new features:

- Thread names (MS_VC_EXCEPTION)
- UNICODE box characters clipboard mode
- Multiline debugging strings (of large size)
- On debug string, OllyDbg attempts to find call to OutputDebugString()
- INT3 breakpoints set on the first byte of edited memory area are retained
- Decoding of User Shared Data block
- Addressing relative to module base
- If plugin crashes, OllyDbg will report its name
- etc, etc.

I have received many bug reports. Some of them are solved, some are not. There is a very nasty bug that I was unable to reproduce: OllyDbg crashes with memory access violation inside the GlobalAlloc()?!! Either OllyDbg unintentionally taints internal data structures used by memory manager, or some virus scanner overreacts, or this is a bug of Windows itself? If you have any clue, please let me know.

That's all for now. I will make a short vacations, a week or so, and in order to keep my sanity will not check for new emails. Please have some patience!


April 11, 2011 - OllyDbg 2.01 alpha 3. Here it is!

A major update with many new features. Here are the most important:

- Support for multi-monitor configurations
- Hardware breakpoints and fast command emulation now co-operate. That is, run trace rund at full speed (up to and exceeding 500000 commands per second) even if there are hardware breakpoints set
- Purely conditional breakpoints during run trace are strongly accelerated
- Stepping, tracing and execution till selection with hardware breakpoints instead of INT3. Controlled by option Debugging | Use HW breakpoints for stepping
- INT3 and hardware breakpoints allow to declare their location as an entry point and specify call parameters for protocolling
- Scan for hidden modules. .NET environment frequently loads modules but does not report them to Debugger
- Search window keeps up to 8 last searches in a separate tabs
- Option to load .udd information even when path, file name or file checksum is different
- Option to save .udd file on request
- Expressions allow for DWORD=="text". Doubleword is interpreted as a pointer to string, comparison is done both in ASCII and UNICODE modes
- Updated decoding of several rare commands
- List of windows. I get address of window function directly from the Window tables. This is tricky but works perfectly
- ASCII dumps and ASCII strings in Binary edit are displayed according to the seleced code page (option Appearance | ASCII code page)
- Memory allocated at address 0 will be correctly recognized and displayed. (Yes, it's possible - I was also astonished by this fact! In this way one can address data using NULL pointer!)
- Improved post-mortem dump. I was unable to find the reason for several reported crashes because they occured in the system DLLs. Now when creating the dump I attempt to backtrace the stack
- Several not-so-inportand changes, like accelerated analysis of tricky code sequences, option to decode registers for selected command, new origin on non-command (safeguard: no shortcut), correct truncation of very long file names in the main menu, restarting of the last loaded executable even when several OllyDbg instances are running in parallel, etc, etc
- And, of course, multiple bugfixes.


February 20, 2011 - OllyDbg 2.01 alpha 2. Here it is!

Version 2.01 alpha 2 is an intermediate functional release with many new useful features.

The most important novelty is that this version is compatible with Windows 7. I have tested it under Win7 Home Premium 32-bit. If you find any problems, please inform me immediately. Don't forget to add the screenshot of the Log window.

Other improvements:
- Aware of avast! antivirus and modifications it makes to the PE header;
- .NET analysis, very rough yet. .NET debugging is not supported, but at least I can disassemble CIL and parse .NET streams;
- Speech API support. You need SAPI 5.0 or higher installed on your computer. Open Options, select Text-to-speech and check "Activate text-to-speech";
- List of found switches;
- List of referenced GUIDs. Internal database keeps ca. 8000 known GUIDs. Additionally, OllyDbg scans registry and extracts GUIDS registered on your computer;
- Search for modifications;
- Creation of backups from the executable file. If you suspect that virus has modified the code in the memory, just extract the backup from .exe or .dll and search for highlighted modifications. Note that OllyDbg does not restore imports;
- In Open dialog you can specify the current directory for the Debuggee;
- Chinese and other UNICODE file names are correctly preserved in the ollydbg.ini;
- Multiple less important features and bugfixes.


February 08, 2011 - Thank you for your help!

In a very short time, I've received several nice solutions to my problem. The most straightforward: ICorDebugProcessQueryInterface(IID_ICorDebugProcess2...). It means that, contrary to what Microsoft tells us, ICorDebugProcess2 is not an extension, but a part of ICorDebugProcess!

To Michael at gmx.de: the matrix in which we live refused to deliver my thanks!
I'm sorry to have to inform you that your message could not be delivered to one or more recipients. It's attached below.
Diagnostic-Code: smtp; 550-5.7.1 {mx051} The recipient does not accept mails
from 't-online.de' over foreign mailservers 550 5.7.1 ( http://portal.gmx.net/serverrules ) (in reply to RCPT TO
command)


February 06, 2011 - A desperate call for help!

For almost a month, I'm struggling with .NET debugging. Parsing .NET executables and disassembling CIL was easy, maybe too easy... Now I have a .NET method, and want to locate the corresponding JIT-compiled native code. Microsoft has a large set of COM interfaces that implement .NET debugger; one of them, ICorDebugCode::GetILToNativeMapping, does exactly what I want. The documentation is more that sparse, the implementation is awful, HRESULTs are misleading, but somehow it works.

Good? No, not good at all. To use GetILToNativeMapping, I must attach to the process as .NET debugger, and can't use debugging API functions, like WaitForDebugEvent or ReadProcessMemory, directly. I even can't set an INT3 breakpoint by myself, because this would interfere with the COM. Instead, I must call ICorDebugProcess2::SetUnmanagedBreakpoint.

Well then, what a problem?.. ICorDebugProcess2 is "a logical extension of ICorDebugProcess Interface" (c) Microsoft. This type of interface (I mean,  extension methods) is implemented first in C# 3.0, but I'm a rather conservative person and still use old good Borland C++ Builder 5.0.

Now is my question to COM gurus:

- Given ICorDebugProcess, how can I call ICorDebugProcess2 methods in Borland?

If you are .NET guru, maybe you can answer this:

- Given running .NET application, is there a way to get correspondence between CIL code and compiled native code directly, without ICorDebugxxx?

As always, please answer to ollydbg@t-online.de. Correct answer to any question will significantly accelerate the OllyDbg development. Thank you in advance!


November 20, 2010 - OllyDbg 2.01 intermediate alpha . Here it is.

Although declared alpha, this is a debugged and fully functional version. It implements about 40% of my plans for 2.01, among them:

- Ported to UNICODE. Multilanguage support for ASCII apps in modern Windows is practically non-existing, and I got tired bypassing all such incompatibilities. This step means that version 2 will not work on Windows 95 and 98. Anybody cares?..
- Source debugging is here again, a bit incomplete. It supports only Microsoft compilers via dbghelp.dll. New is support for symbol server, stack walking using dbghelp and names of procedure parameters.
- Debugging of standalone DLLs, in my opinion significantly better than before. It even measures call duration with sub-microsecond resolution (good for profiling) and saves contents of dumps between sessions!
- Many small improvements, like pause only on selected module(s), breakpoints on all intermodular calls, automatical closing of dump windows on different process, bugfixes, and more.

AND IT IS STILL NOT FIT FOR WINDOWS 64!!!

Oh, and yes, soon I will start OllyDbg 64!..


Last update: June 04, 2010 - final release (corrected).
Here it is.

It's slowly becomes a tradition: immediately after releasing a final version, I must post a bugfix! This time, I have missed a crash in the popup menu of the breakpoint window. Tittan and Jack were the first to report it!

And once again: no, this version does not work under Win64!


Last update: June 02, 2010 - final release. Here it is.

You haven't heard much about OllyDbg 2.0 for a long time. Unfortunately, I am permanently busy and have not much free time.

But there is a progress. I have made many changes and bugfixes, among them:

- prn bombed me with many, many ideas and found bugs. For example, he reported massive problems with UNICODE filenames that use extended charset. And no, Windows doesn't convert them automatically to ASCII. As OllyDbg is still an ASCII application, now I convert such names to old 8.3 DOS format.  Active breakpoint were not marked in the corresponding breakpoint windows; memory breaks were falsely hinted, and so on, and so forth... Thank you, and please don't stop!
- William reported bugs with PUSH AH etc. Yes, there are no such commands, but OllyDbg v2.0 happily assembled them.
- Keyboard shortcuts did not work in Edit/Search dialog. Reported by mailnew2ster.
- Ange gave me the complete list of 80x86 commands as a compiled executable file. He found many assembly/disassembly errors. With his list, we were able to remove them. He also criticided my "English" help file for grammatical errors, silly old me!
- Eric, deepzero and karmany reported problems with highlighting and comments.
- John found out that Always on top may hide error messages.
Aaron and many other reported crash on structure decoding, namely on those where some elements were unnamed, like elements of array.
- I thought that exe/dll with 5 MB code section is really large, until Ivar sent me an executable which code section was 83,079,168 bytes (SEVENTY NINE MEGABYTES) long! Analysis attempted to allocate more than 1,5 GB of memory - still not a problem, but due to fragmentation, my memory manager was unable to execute the request. It was necessary to redesign it.
- Rinze pointed at problem with memory breakpoints on stack. OllyDbg did not check memory addressed indirectly by ESP.
- NCR asked for the search for process name in Attach window by typing its name.
- numax suggested list of user comments.
- Hopefully OllyDbg will support Chinese and Japanese fonts in dialog boxes (Edit/Search data), main issue that we tried to debug together with locklose. It should work, but I can give you no warranty. Please check.
- And, a couple of days ago, edemko discovered that conditional jums on LOOPZ/LOOPNZ are falsely predicted. This was the last bug corrected in the version 2.00.

The list is far from complete, altogether I received more than 100 reports and suggestions. So for all contributors: Without your help, OllyDbg 2.0 would not exist. Thank you very much!

And now about my plans for the future. Probably I will convert OllyDbg to UNICODE. There are too many places where ASCII is not fully supported by Windows, like file names with extended charset or controls that don't receive WM_WCHAR. This will mean end for Win95 and WinME users. Those who use WinNT, 2000, XP and Win7 will notice nothing. Of course, plugins will be forced to UNICODE, too.

I plan to introduce experimental plugin support in the version 2.01. The interface is not yet defined. If you have written plugins for v1.10, please send me your ideas and suggestions now!

Version 2.01 will finally work under 64-bit Windows. Probably I will start developing 64-bit OllyDbg, but this depends on my free time.


Last update: December 03, 2009


Please read it carefully before complaining:
1. OllyDbg 2.0 is rewritten from scratch.
2. No, plugins are not yet implemented.
3. Yes, they will be implemented again - presumably in v2.02.

The final beta release (odbg200k.zip) can be downloaded here.
Older versions: odbg200j, odbg200i, odbg200h

December 3, 2009
The last beta, with rudimentary help (and I hope to improve it in the release). The only really new feature (commented out in the second beta) is debugging of child processes. Other modifications are evolutional: much more stable (and tricky) debugging engine, more known functions, more or less consistent support for UNICODE and UTF8 in dialogs and comments, many bugfixes.
Please check this version thoroughly and don't forget to report all errors, including grammatical. The release will follow soon!
March 28, 2009
The second beta. I've planned that it will come with the more or less complete help file. Unfortunately, I had no time to write it. Therefore there will be also the third beta release... soon.
There are many - over 20 - bugfixes in the beta 2, some of them are really critical. As promised, there are no significant changes, with two exceptions. The recognition of UNICODE strings is vastly improved, they are no longer limited to ASCII subset (option "Use IsTextUnicode()". Also I recognize strings in the UTF-8 format. By the way, if you have some small sample program with the free source that uses UTF-8 strings, please send it to me (together with the screenshot of displayed strings) so that I will be able to test OllyDbg.
The second new feature is in the run trace. New option "Pause when EIP points to modified command" helps, for example, to find the real entry point of the SFX-ed code. Just don't forget to create backup first (or use another new option, Auto backup user code)!
December 23, 2008
The first beta release. "Beta" means that there will be no significant changes till the final v2.00. Now it supports memory and hardware breakpoints. They are fully conditional, and the number of memory breakpoints is unlimited. Fast command emulation takes memory breakpoints into account. In fact, run trace may be much faster than the full-speed run if the number of false access violations is high. Active hardware breakpoints turn emulation off, but this may change in the future.
SSE registers are fully supported. OllyDbg understands all command set extentions up to SSE4. AMD's SSE5 is not supported, but as far as I know, there are no SSE5-capable processors yet.
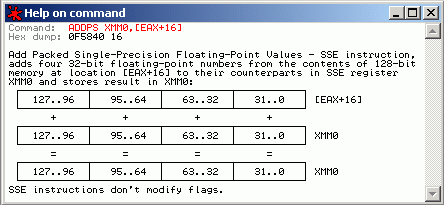
Help on command covers all FPU commands. Help on some registers and bits is also available.
Autoupdate of dump windows may also be useful.
August 21, 2008
Big update. Powerful run trace, profiling, analysis, many small improvements and multiple bugfixes. Support for AT&T syntax is experimental and limited to disassembler. If you find any errors, please let me know!
May 24, 2008
Internal emulation of simple commands (Options|Run trace|Allow fast command emulation) has made run and hit trace 15 (fifteen!) times faster. On my Athlon 4000+, standard run trace executes 35000 commands per second. With the emulation on, OllyDbg traces 500000 commands! For simple programs, this may be close to the real-time execution - in the step-by-step mode, with the full protocolling.
Emulation covers only the small subset of 80x86 commands - moves, PUSH/POP, arithmetical and boolean operations, comparisons, shifts, jumps, calls, returns and LEAs. No multiplications, prefixes, loops or string operations, no FPU or MMX; still, OllyDbg passes to the application less than two percents of commands.
Frequently one uses run trace together with the run trace condition, like: "stop trace when EAX==0x123456". Up to now, the inetrpreter parsed conditional expression on each step. However, this was too slow for the accelerated trace. Now I compile expressions to the simple pseudocode and use a very quick interpreter to estimate the condition. As a result, the above comparison is processed in only 130 nanoseconds. Not bad!
Oh yes, and command help now includes the string commands, too.
May 8, 2008
Improved and bug-fixed debugging engine. Help on all 8086 commands, except for string manipulations.
April 19, 2008
Pre-alpha 5: hit trace! Maybe you have tried to use hit trace in the version 1.10, only to discover that it doesn't work with non-trivial programs. Hit trace in version 2 is different: instead of replacing all recognized commands with INT3, I set breakpoints dynamically on all non-processed branches. It seems that 20-30 thousand breakpoints is not a problem for the new debugger. Also in this release: just-in-time debugging, command line, several bugfixes. Help on command is ready for all non-SSE/non-FPU commands till LEA.
March 11, 2008
Pre-alpha 4: name lists, search for text strings, floating-point constants and intermodular calls, run trace conditions, syntax highlighting (but default colours are not yet set), pause on thread, names of the arguments on the stack etc. The analysis of large modules is much faster now.
December 25, 2007
Pre-alpha 3: many different features like attaching to running process, detaching, run trace (as yet without fast stepping), real-time stack analysis, recognition of TLS callbacks, guarded memory, intermodular calls etc. Look at the comment column in the list of calls - you will enjoy it!
October 20, 2007
Removed 5 bugs; strongly improved functionality of existing windows; reduced number of false switches
October 09, 2007
First buggy pre-alpha code


October 11, 2007 - First bug reports

Shame on me! In only one day, I have received 15 bug reports related to the v2.0 pre-alpha code! Most of them concentrate around the protection violation at address 477AC3 (a more or less obvious bug), but there are also other crashes reported. What should I say? Thank you! Without your steady help, OllyDbg 1.10 would never reach its actual quality. Hopefully, in some time second version will reach at least the same standards... Anyway, in the couple of weeks there will be update here. And - thank you again! Please keep it this way!


October 09, 2007 - Pre-alpha version

The child is big enough to show it to the public, so download this and have a look. Is this version functional? Yes. Is it better than 1.10? Definitely not. Is it better than v1.00? In some aspects - maybe, but in general - no. Can you use it for debugging? Yes, but you will miss many, many features... So please don't be too critical and send me no emails - this version is not even a full-featured alpha, and will change dramatically in the next several weeks or monthes. But in the case that OllyDbg will crash and generate errorlog.txt, be kind and do send me this file - I will need it for debugging. And now - enjoy!


July 08, 2007 - UDD files


Now OllyDbg 2 can save analysis data to the .udd files. Comparing to the previous version, they are very big - two to three times larger, mainly due to the register predictions. For almost every command I keep ESP and EBP relative to the entry point. Many modern compilers don't use standard stack frames; instead, they address all arguments and local data over ESP. Predictions allow to decode the meanings of ESP-related offsets. They are also very helpful when tracing the call stack.

It takes significant time to load such a huge amounts of data. First version took between 0.1 and 0.7 seconds per module. With full analysis of all modules requested (and this will be the default option), startup took several seconds on my Athlon 4000+. Now, after several days of deep optimizations, this time got three times shorter.


June 03, 2007 - Development continues

The progress in the last two weeks is enormous. List of Extremely Important Things To Do got five items shorter. But news of this kind are roughly equivalent to the summer headlines in the newspapers; now I want to tell you something different.

While testing MinGW compiler, I wrote a small console application:

   int main() {
     MessageBox(NULL,"I'm a little, little code in a big, big world... Hello, world!",
       "Hello, world",MB_OK);
     return 0;
   }

Highly optimized release version of this code looks this way:


MinGW reserves space on the stack and moves arguments instead of pushing. But note the following: The order of arguments for MessageBox() is hOwner, Text, Caption, Type. MinGW has changed this order; still, OllyDbg 2 was able to recognize the arguments.

MinGW (in fact, GNU) is an excellent compiler, its only weakness is that many exotic APIs are not yet in the headers.

That's all for this time, bye!


May 18, 2007 - Happy birthday, Version 2?

What is the birthday for a program? The day when it becomes useful for the first time. Today it happened. I have finished the debugging engine.

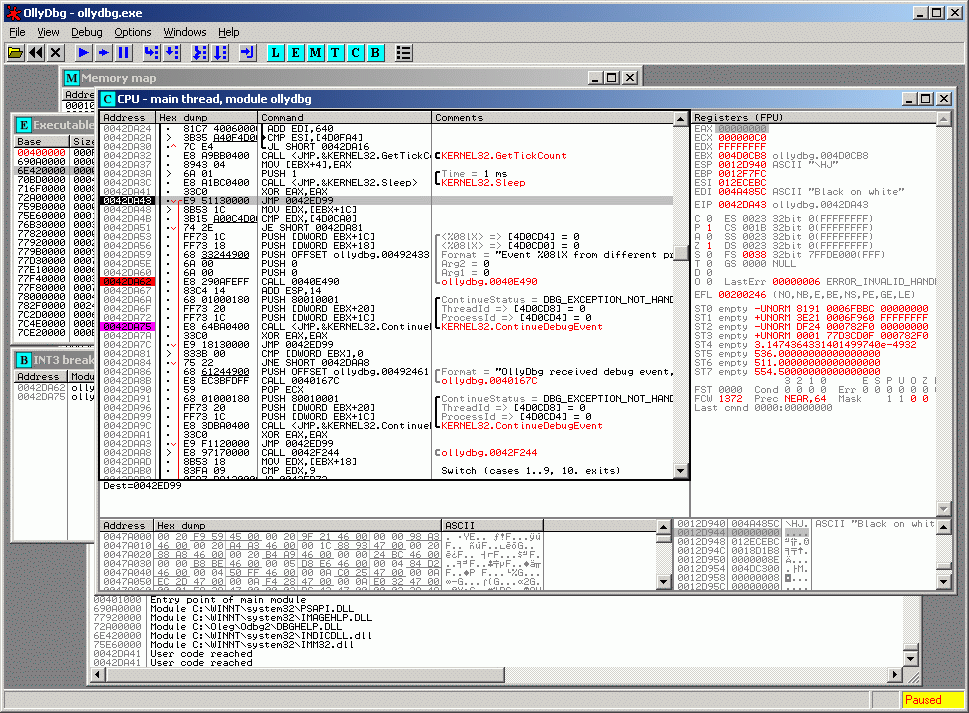
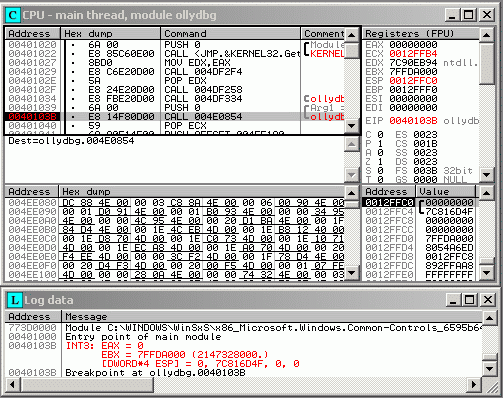
Well, not really. There are no memory or hardware breakpoints yet. OllyDbg can only set single-step traps and INT3 breakpoints, and run trace is not yet implemented. But all this is unimportant. I can step in and over, set conditions and log results; in brief - OllyDbg 2.0 has become a DEBUGGER. On such happy event, everybody wants to have a look on the newborn - here is a full-size picture:


The baby is almost new and can't take a walk, and it is very weak. This means, you must wait a bit longer till doctors will allow you to take it into hands. In my ToDo list, there are more than twenty items of priority AAA+ - Things To Be Done Before One Is Allowed To Even Wonder About Alpha Release, like:
and so on, and so forth. So be patient, as ever :)


April 17, 2007 - Command search.

Finally I have finished the command search module. Basically, you supply a pattern, like XOR EAX,EAX, and OllyDbg locates all such commands in the memory block. Version 1.xx already featured this, but in a very limited form. For every supplied pattern, old program created the set of code/mask pairs and compared them with the binary code. This approach is simple and quick but features several drawbacks that strongly limited its usefullness. For example, if command is expected to have several prefixes, one must create models for any combination. But the main problem was that code/mask approach was unable to handle memory addresses. x86 addressing model is extremely complex and inhomogeneous, with many exceptions from the regular pattern. Let's take, for example, MOV EAX,[EBX]. There are 16 (sixteen) different binary encodings:

   8B03            - the simplest form
   8B43 00         - form without SIB with 1-byte zero displacement
   8B83 00000000   - form without SIB with 4-byte displacement
   8B0423          - form with SIB byte without scaled index
   8B0463          - same
   8B04A3          - same
   8B04E3          - same
   8B4423 00       - SIB byte, 1-byte displacement, no index
   8B4463 00       - same
   8B44A3 00       - same
   8B44E3 00       - same
   8B8423 00000000 - SIB byte, 4-byte displacement, no index
   8B8463 00000000 - same
   8B84A3 00000000 - same
   8B84E3 00000000 - same
   8B041D 00000000 - SIB byte, 4-byte displacement, scale 1, no base

Amazing, no?.. All attempts to reuse the old concept in the new OllyDbg version were in vain, so I was forced to throw it away. New model consists of the opcode, list of prefixes and  packed description of operands. Search routine disassembles executable code and compares result with the model. Due to the very fast disassembler, this approach is almost as fast as the old one, but unbelievably flexible!

New search supports more pseudoelements than in the previous version:

   R8        - any 8-bit register

   R16       - any 16-bit register
   R32       - any 32-bit register
   REG       - any general register (size is not important, assumed R32 in address)
   RA,RB     - semi-defined 32-bit registers
   SEG       - any segment register
   FPUREG    - any floating-point register
   MMXREG    - any MMX register
   SSEREG    - any SSE register
   CRREG     - any CR register
   DRREG     - any DR register
   CONST     - any constant
   ANY       - any operand or memory address (size is not important)

MOV ANY,ANY, for example, matches any MOV command:


MOV [ANY],ANY - all writes to the memory, dependless on the size:


Note that 16-bit address is included into the list. As you probably know, Windows reserves first 64 K of the process's memory as a trap for the NULL pointers, so flat-mode 16-bit access has no chances, with one important exception. Selector FS points to the thread's data block that keeps thread-dependent information available to the application.16-bit version is 1 byte shorter than its 32-bit countrepart (but may execute longer due to the additional prefix). By the way, first doubleword in TDB is the pointer to the Structured Exception Handling chain that implements try-catch constructs. It's easy to find all SEH chain changes with the single search for MOV [FS:ANY],ANY:


Search for XOR RA,RA finds all commands that zero some register by XORing:


whereas XOR XA,XB - cases where XOR just manipulates bits:


JMP [R32*4+CONST] will find table jumps, LEA RA,[RA*5] - fast multiplications of 32-bit register by 5 (of course, in reality this means [RA*4+RA]), and so on.

Oh, and I'm curious, how useful will you find this feature:


That's all for now, bye!


February 24, 2007 - Progress.

The development of version 2.0 goes steadily forward. In the last three monthes I have written more than 350 K of debugged code. Backup, search, jumps, history, conditional expressions, watches, Assembler - all the stuff necessary for productive work. And - for the first time, 2.0 has paused on the breakpoint!

Yes, this is a big step. This means that the infrastructure is ... well, not yet completed, but is already so stable that it can support complex high-level functions. When I browse through the sources, I'm full of pride that the code is so well-structured, logical and clear. Unfortunately, this was not the case with 1.10. Initial design had several flaws - in 2000, I had no experience and was unable to foresee the requirements of the final version. Every small modification required significant efforts and lengthy testing. So finally I've decided to close the project and rewrite it almost from the scratch.

The first steps of any redesign are very hard psychologically. Maybe you've experienced similar problems - you write loads, heaps, piles of code, but your project is almost dead. All it can is some primitive stuff, like it was in my case - disassembling of several hardcoded binary sequences, dumps of memory blocks at fixed addresses, provisorical code and debugging outputs everywhere, and next to this garbage there is your old version, five years of successfull development, maybe also full of trash inside but at least functional and with shiny storefront...

Anyway, I'm past this stage. OllyDbg 2.0 lives, and it makes plenty of fun again to develop. You've waited for so long - so be patient, please, and sooner or later I'll introduce you my promising younger son :)


November 12, 2006 - Analyser.


Almost two years are gone since the last update of this page. But you don't forget me. The counter has crossed the magic limit of 1,000,000 impressions. So I feel me a bit ashamed and now will try to make up for your patience. Starting from now, every two or three weeks I will inform you here about the actual state of my work.

I'm frequently asked: "What happened to OllyDbg 2.0? Why is it not here?" Well, it is mostly my immanent laziness and, to lower extent, lots of other tasks and projects that have stopped the development of the second version. Nevertheless, it is not dead. In the last month I wrote more than 100 K of code, and now want to show you some highlights of the future version, mainly its new powerful analyser.

Despite highly complex features, like full code prediction, new version is significantly faster than its predecessor. But speed does not influence the quality of recognition. See, for example, how many calls were decoded by old OllyDbg in a large 3-MB application:


and by new:


Impressive, isn't it? Note that list of known functions in v2.0 currently includes only three system DLLs.
New version has strongly improved prediction of registers (especially ESP) and stack contents:


is able to recognize and decode register variables:


functions with variable number of arguments, like formats:


and cases when parameters are copied, rather than pushed, to the stack:


It determines loop variables, i.e. registers or memory items that change by the same amount on each loop iteration:


To help user, it even can rename and change decoding of arguments in some argument-depending cases:


New Analyser features also more reliable distinguishing between code and data. All in one, when OllyDbg will be ready, it will make debugging easier and understandable... I hope.

Part two will come in a couple of weeks. Bye!